Why We Started
Stock Charts Blog
Stock Charts Blog
Exchange stock market links with us!
Behind Stock Charts Guide
How to use my stock charts blog to deeply understand, read, and chart your own stocks easily, quickly, and frequently.
Jun 29, 2015
Stock Chart Analysis Works
Stock chart analysis really works wonderfully, for the most part. Technical stock market investors use it to make stock investment decisions. They use it to decide when to buy, and sell their stocks.
Jun 29, 2015
Why Chart History of Stock Market?
Sometimes, analyzing the chart history of stock market can teach you some about stock market investors. Why? Stock market charts are full of mysterious history that can be revealing, and fascinating.
May 12, 2013
Ford Stock Chart Challenge
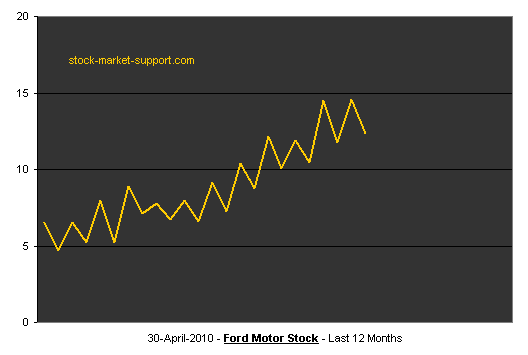
Ford stock chart can be a teaching investment decision system. It can also teach you how to create your own basic Ford Motor stock chart. It can also teach you how to read your F stock charts easily.
May 12, 2013
GS Stock Chart Pattern
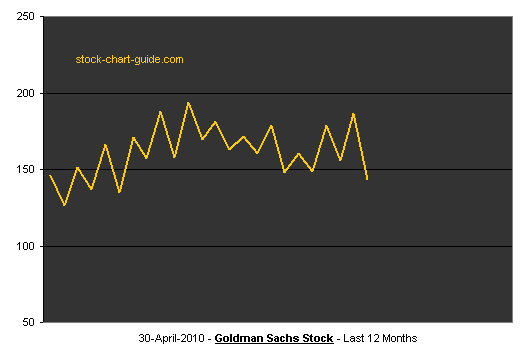
Reading GS stock chart can be simple. Creating your own Goldman Sachs stock chart pattern is even more fun. Where do Goldman Sachs Group Inc stock investors buy? Where do they sell?
May 01, 2012
Contribute to Stock Charts Guide
Would you like to share your knowledge about stock charts guide? Great, find out how you can submit your story or tip here.
Nov 19, 2011
Free Weekly Stock Charts Analysis
Weekly stock charts, and daily stock charts, and monthly stock charts, truly can assist a stock market trader. But to a certain extent! How about the rest? Like mental and emotional discipline.
May 27, 2011
Why Interactive Stock Charts
Interactive stock charts, definitely is another cool way for you to get actively involved with stock market charts. Clicking on stock chart links, updating your stock price chart, in real time.
May 21, 2011
Stock Chart Software
Stock chart software is another option to manage your risks. There are so many different versions of stock market programs and software online. There are also stock traders that trade without software
May 14, 2011
Make Reading Your Stock Charts Simple
When you are reading your stock charts, first look for entry point! Soundly, look for the stop loss exit point! Finally, look for your profit taking exit point! Why are these 3 steps so vital?
May 09, 2011
Free Technical Stock Chart Analysis
When you find a free technical stock chart analysis, with free stock quotes charts, and a free stock market charts software, you can build a stock trading system! Is it enough for you to make money?
May 05, 2011
Why 3D Stock Charts
It is easy to use a 3D stock charts system to spot profitable stock trades. 3D stock chart has been assisting so many to make stock trading decisions. Can a 3 D really chart your profitable stocks?
Apr 30, 2011
Easy To Read Stock Charts
Sometimes, an easy to read stock charts can give you a sense of clarity. When you have a sense of clarity, reading your stock price charts allows you to make better stock investment decisions.
Apr 24, 2011
Chart Stock Price
When you chart stock price, you are charting behind the stock market behavior. The really cool thing about charting stock market fluctuation is that it gives you the freedom to make good decision.
Apr 16, 2011
Historical Stock Market Chart Price
Historical stock market chart has been very vital to me. Because when you collect and chart the stock market historical data, you begin to notice new stock opportunities, new stock investment risks.

